Forming a ratio of puts to calls is an excellent way to determine what investors are thinking about the market. Puts are essentially a bet that prices will decline and Calls a bet that they will rise. When there is a higher-than-normal amount of put buying to call buying, it means investors, in general, are expecting prices to decline. When the ratio is lower then normal, it means they expect prices to rise.
The puts to calls ratio was created by Marty Zweig and introduced to investors in a Barron’s article in 1971. Since then, it’s been used by market technicians for over 50 years when looking for extremes in investor sentiment. When the article was published, the data came from over-the-counter traders, as there was no formal exchange. With the creation of the CBOE in 1974, it became possible to gather the data from the exchange every day.
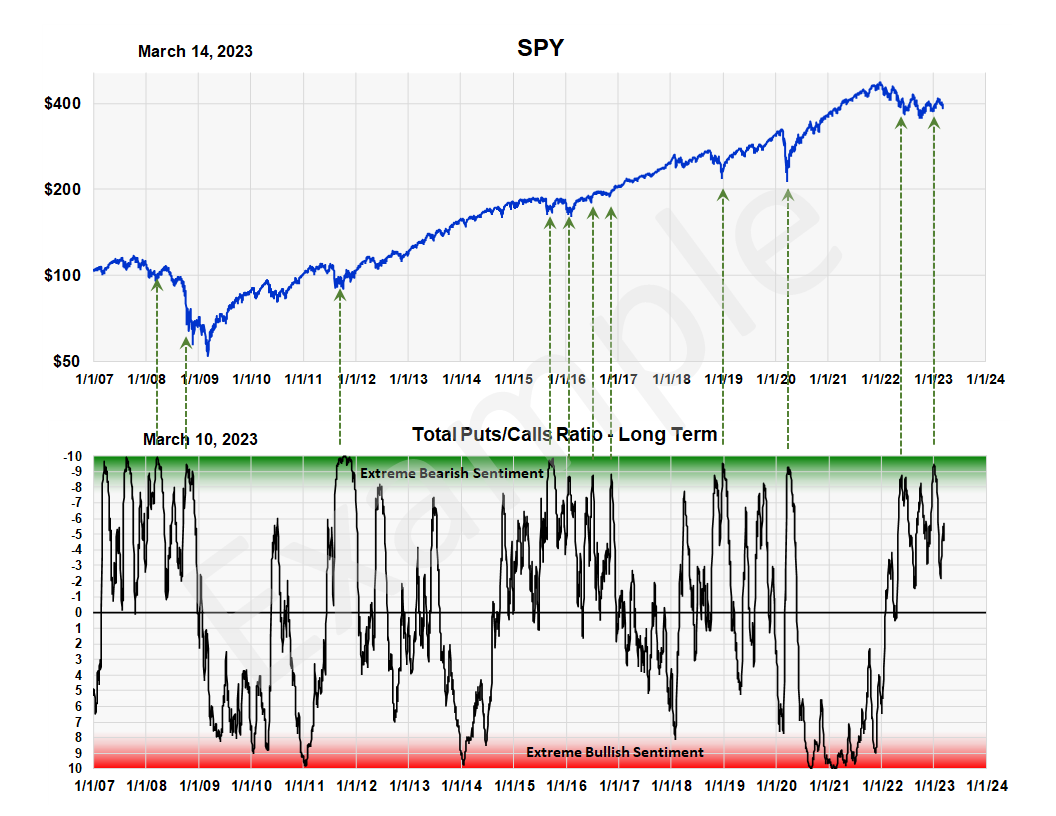
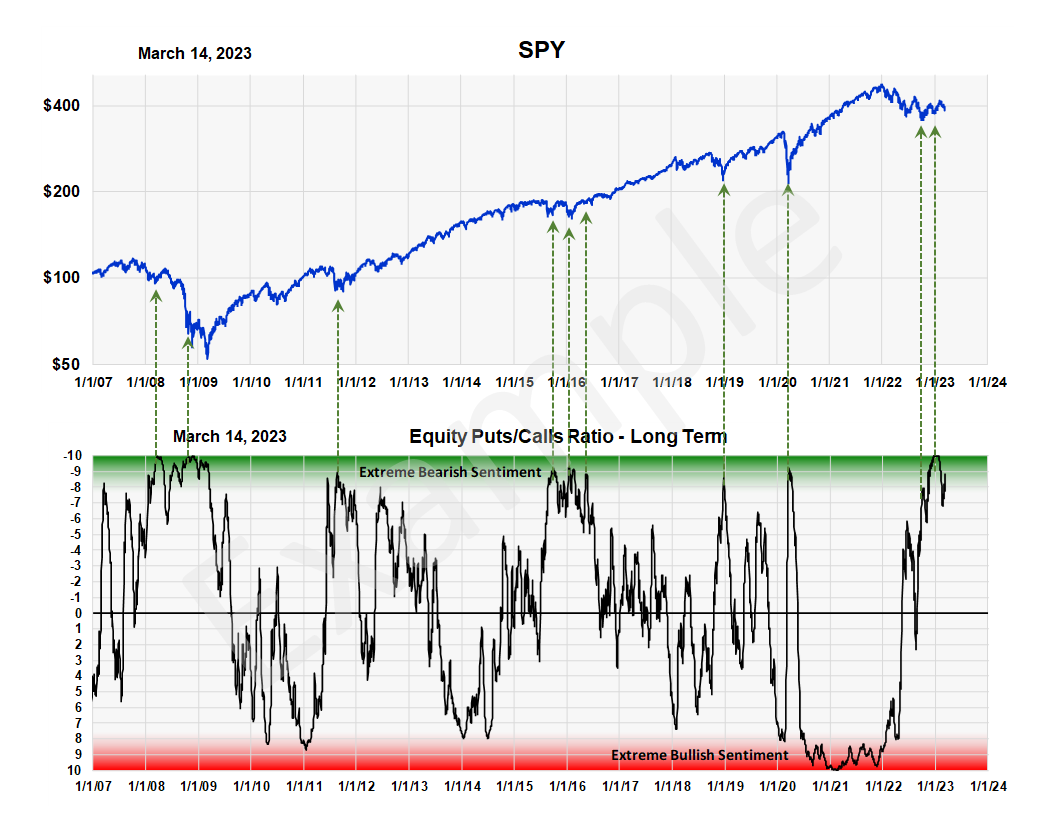
Option traders, however, are notoriously short term. To create an indicator that represents a long-term view, we calculate a moving average of the daily numbers. We use a time weighted moving average which, in practice, is approximately equal to a normal, 20 day moving average. We then plot the moving average on our SK ranking scale, which also contains the red and green zones.
Two ratios are calculated – an “equity” puts to calls ratio and a “total” puts to calls ratio. The equity ratio is formed from the sum of all put and call trades in individual stocks. The total ratio includes all stocks plus the various sectors and index’s that also trade options. We have found the equity ratio to be the more reliable but there are times when the total ratio is better, so we include both ratios in the MSI composite.