Please watch these two videos. They explain our long-term outlook for the stock market.
Subscribers receive both a written report and a video report each week. The written report – The Sentiment King MSI and Market Forecast – is emailed on Saturday. This report updates all the indicators that make up the MSI and ST-MSI and includes our interpretation and basic forecast for the market.
On Sunday we send a link to our short video report (less than five minutes). It describes all the detailed ideas that are best done visually. The combined written and video reports contain our message for the week. You can see sample reports by clicking on the blue links above.
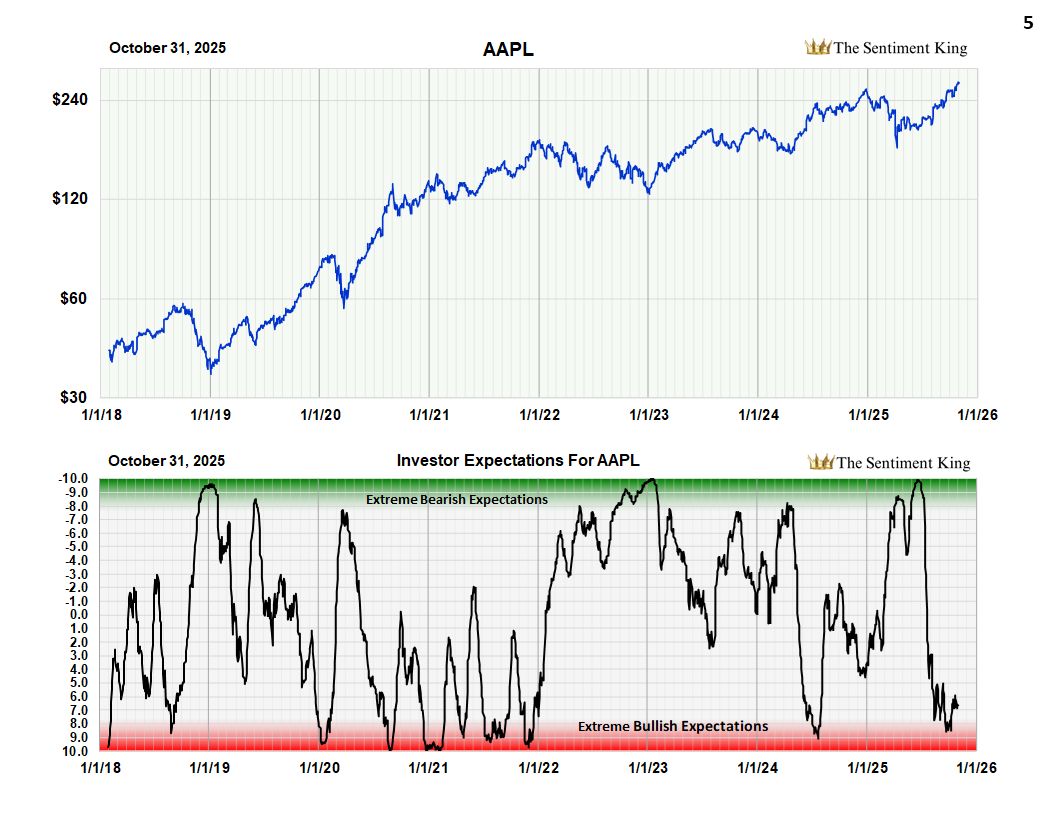
NEW! Subscribers now get our 300-page, weekly sentiment analysis of 100 of the largest traded stocks, including ETFs and Sectors. I would never buy or sell a stock without also looking at its Sentiment King ranking.
Subscribers gain access to all sixteen indicators that make up the MSI and ST-MSI, plus all past MSI and Market Forecasts and video reports.
Monthly and Annual options are subscriptions and renew automatically.
CONTACT US if you would like to upgrade your subscription from monthly to annually.
Please CONTACT US for Annual Subscription Refunds – refund amount will be minus credit card processing fee and number of months reports were received (processing fees can vary depending on country of origin).
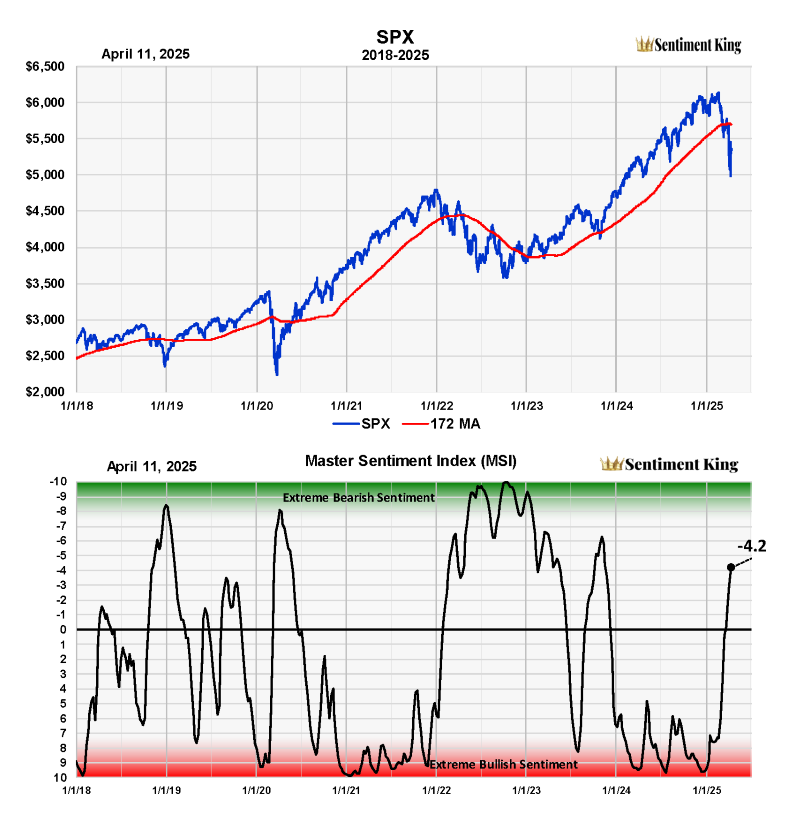
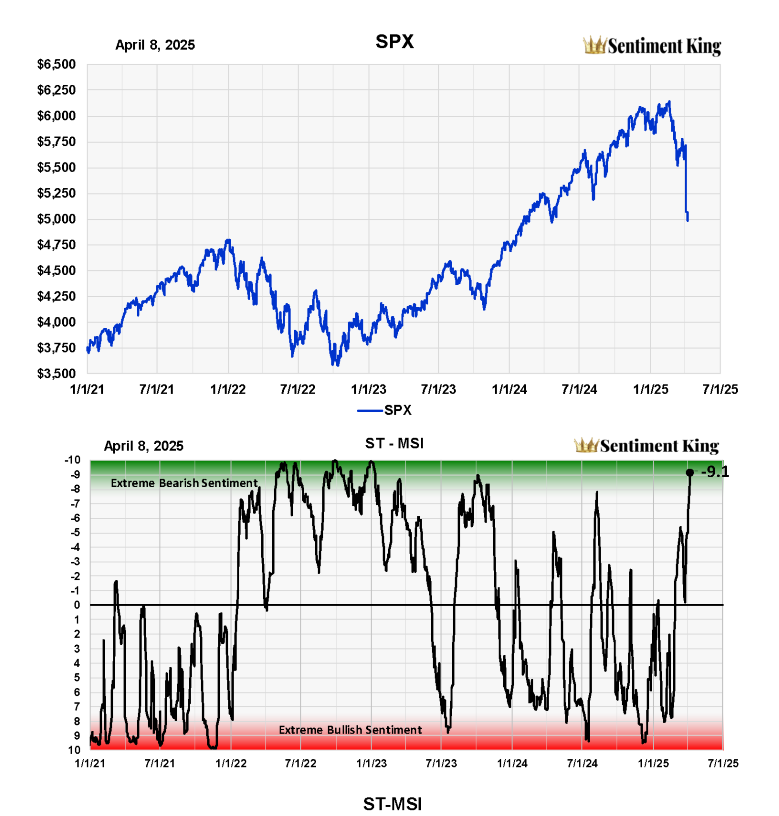
We have two Master Sentiment Indicators – the MSI and the ST-MSI. The MSI is for the long-term (bull and bear markets) and the ST-MSI for the intermediate-term. Both the MSI and the ST-MSI are composite indicators made by combining well established sentiment indicators into one. A blue button explains each one.
The MSI Report and Market Forecast is the weekly update of the MSI, the ST-MSI and our forecast for the market, plus the Sentiment King ranking of long-term bonds and gold. A sample of the report is found in the first blue button.
The Sentiment King Stock Report analyses investor sentiment in 100 of the largest traded stocks. Using our Red Zone-Green Zone ranking system, we find those stocks which have the highest levels of bullish or bearish sentiment based on dollar activity in directed puts versus calls over 20 days. A sample stock report is found in the last blue button.
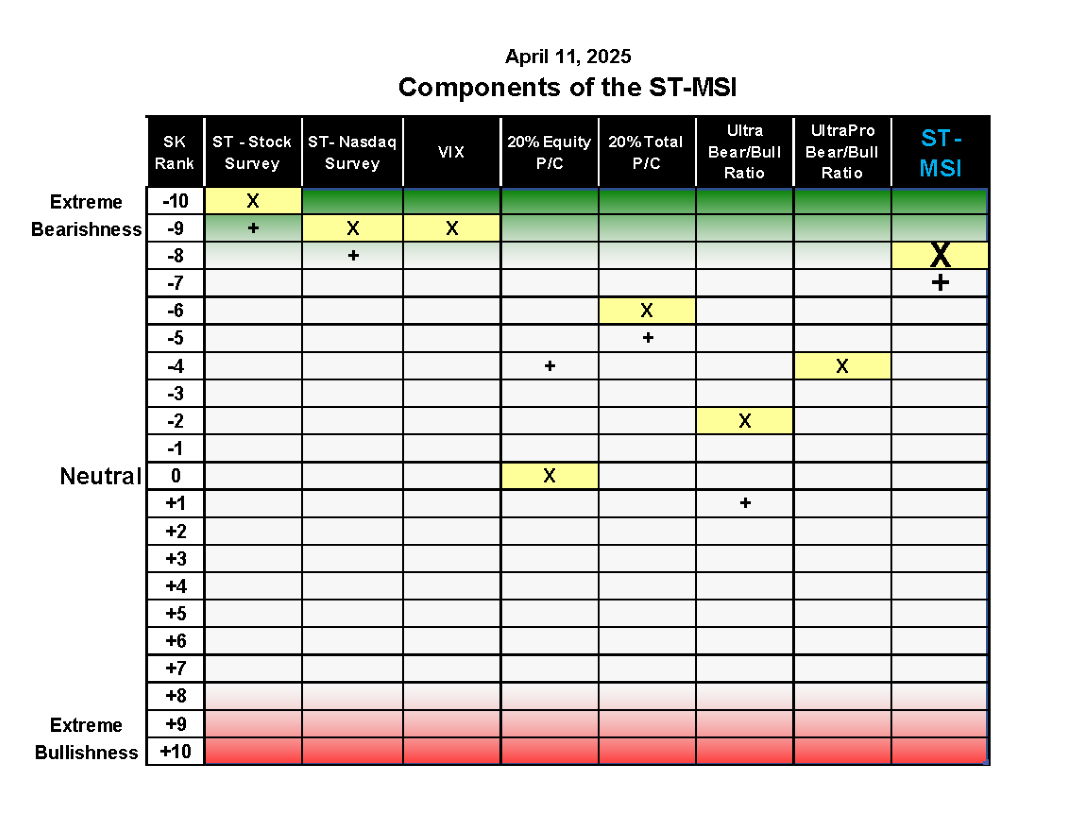
All the indicators are presented and evaluated on the universal Sentiment King “Red Zone – Green Zone ranking system”, which is also explained by a blue button. Click on the graphs to magnify the image.
Table Sample
MSI Sample
ST-MSI Sample
Stock Sample
Table Sample
MSI Sample
ST-MSI Sample
Stock Sample
Video Report Samples
Along with The Sentiment King MSI Report and Market Forecast, we produce a weekly video report similar to the samples on the right.
We hate long videos, so these are kept short (usually under five minutes) to respect your time. They are scripted to get right to the point, be educational and present ideas that are best explained visually.